This post entails rotating axes in flot charts. It is assumed that the reader has thorough understanding of flot charts. To rotate axes, we require the axis labels plugin and tick rotator plugin.
Assume we have a dataset below.
var d1 = [];
var myFruitsCustomData = [];
var fruits = ['apple','banana', 'oranges', 'watermelon', 'peaches',
 'grapes', 'nectarines', 'avacado', 'gala apples', 'pawpaw'];

for (var i = 0; i < 10; i++) {
  d1.push([i, Math.sin(i)]);
}

//x-axis labels
for(var j = 0; j < 10; j++) myFruitsCustomData.push([j, fruits[j]]);
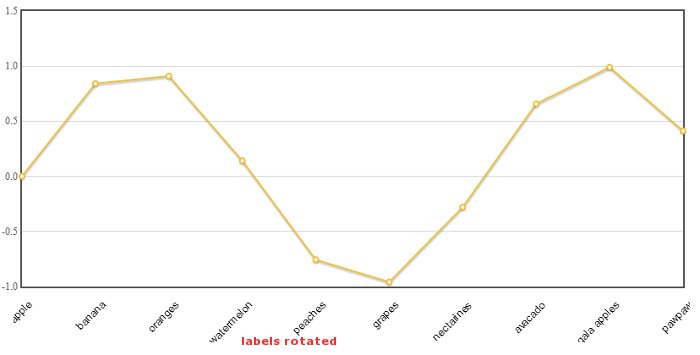
Now we plot the chart using the code below. Take note that x-axis settings has new configs from the above two plugins. The config rotateTicks has a numeric value at which the x-axis is rotated. The x-axis is generated inside the canvas and axisLabel settings are applied to each.
$.plot($("#placeholder"), [ { data:d1 } ],
  {
     xaxis: {
	ticks: myFruitsCustomData,
	axisLabelUseCanvas: true,
	show: true,
	axisLabelFontSizePixels: 12,
	axisLabelFontFamily: 'arial,sans-serif',
	axisLabelPadding: 100,
	rotateTicks: 135
   },
  series: {
	lines: { show: true },
	points: { show: true }
   }
});
Refer to the sample output and download the example.